Jaeger integration with Linkerd
Posted on
Linkerd added support for Distributed Tracing, which means that if your application has enabled tracing based on B3 Propagation, Linkerd proxies would automatically recognize that (as the trace-id is propogated through http headers) and send their spans, provided that the proxies are configured regarding the meshed trace collector endpoint.
Contrary to the popular marketing myth, A service mesh would not be able to give you traces automatically though its in the
request-response path, as it can't map a inbount request to the corresponding outbound requests. So, It is needed
for the application to be instrumented. In languages like Golang, where there is ctx.Context primitive used widely already,
Instrumentation is very easy as the changes required here are to update the application server to generate the
trace-id header and then make sure to pass the ctx.Context everywhere and use it when sending outbound requests.
This is required as the Trace collector, needs a way to map inbound to outbound requests. This is done by using the metadata
passed through the context. Function calls in the middle i.e between in-bound and out-bound, can use the tracing libraries in
conjuction with the passed ctx.Context to send their own spans.
Having the proxy spans (along with extra metadata) part of the full trace is very useful to understand understand the latencies of the proxy that is present in the criticial path of requests handling.
Demo Time: Linkerd with Tracing Add-On :tada:
Let's try and see this in action with Linkerd. First, Linkerd can be installed with Tracing add-on through the CLI. Add-On Configuration is passed through a file.
cat >> config.yaml << EOF
tracing:
  enabled: true
EOF
The tracing add-on installs Jaeger and OpenCensus collector with your Linkerd installation.
Now, Let us apply that configuration to the linkerd install command using the --addon-config
flag and pipe that output to kubectl apply.
linkerd install --addon-config config.yaml | kubectl apply -f -
Let's now deploy the sample injection with injection enabled, and the trace end-points of the meshed oc-collector.
linkerd inject https://run.linkerd.io/emojivoto.yml --trace-collector linkerd-collector.linkerd:55678 --trace-collector-svc-account linkerd-collector | kubectl apply -f -
The above command enables tracing in the linkerd proxies but the application containers still don't have it enabled. Tracing can be enabled in the sample application can be enabled by
kubectl -n emojivoto set env --all deploy OC_AGENT_HOST=linkerd-collector.linkerd:55678
Now, you can port-forward the linkerd-jaeger service to checkout the traces.
kubectl -n linkerd port-forward svc/linkerd-jaeger 16686:16686
Now you can look at awesome traces like,
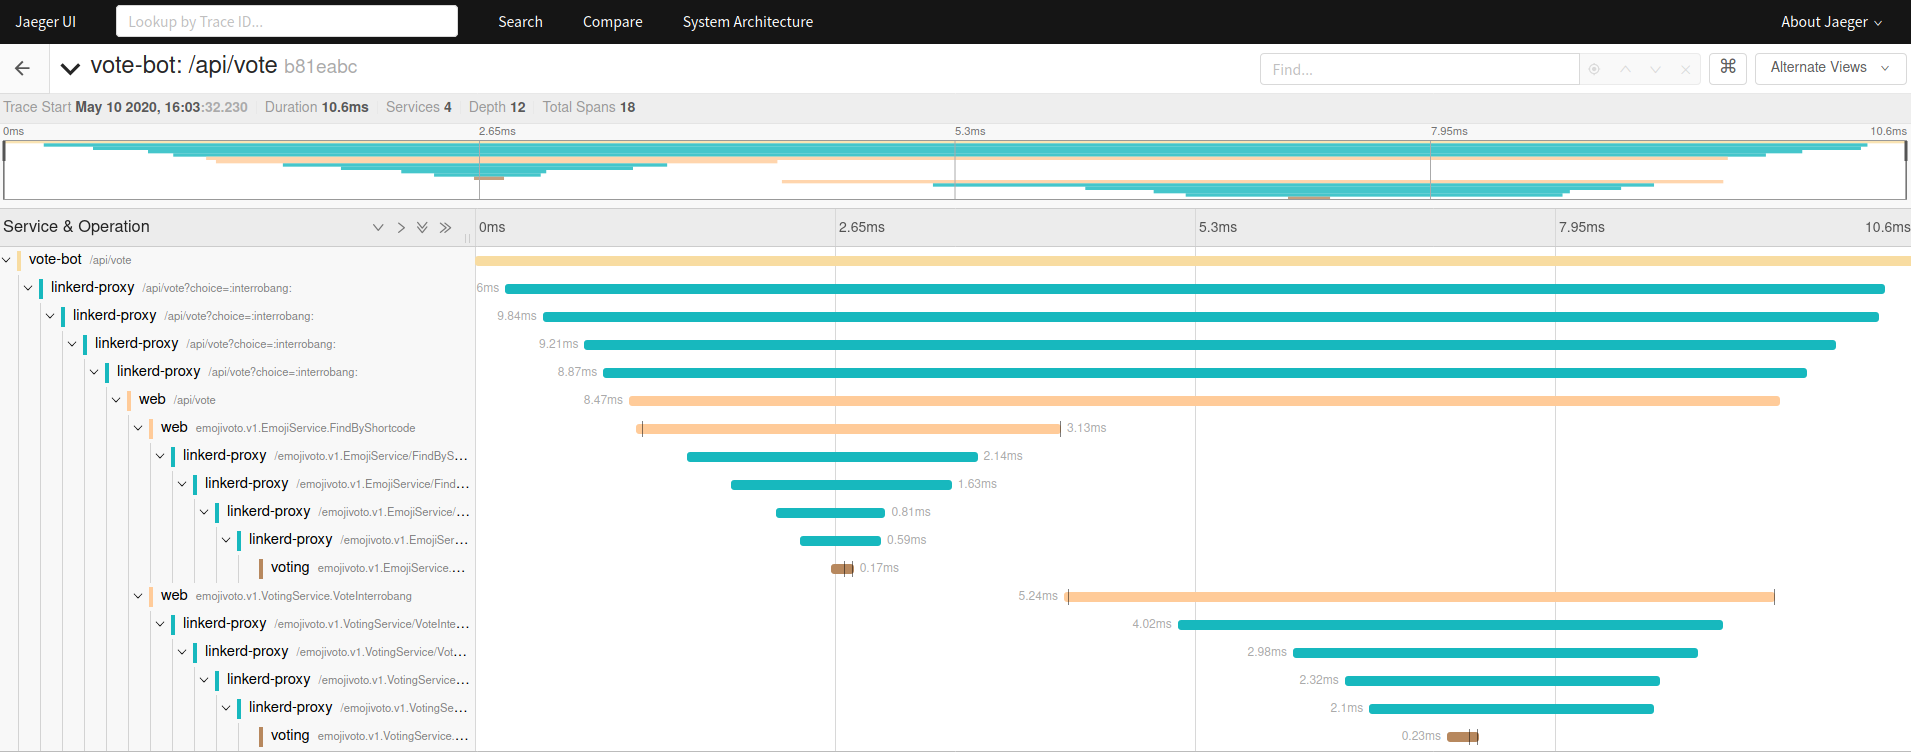
So, As you can see there are spans of the linkerd-proxy. For each request between two meshed components, you can see there are four linkerd-proxy spans.
The first two spans would be the spans sent from the proxy of the client component and will be marked as outbound.
Again, in these two spans, the first one is the span of the application -> proxy, and the second one is the proxy->otherside. They are differentiated by the server and client tags respectively.
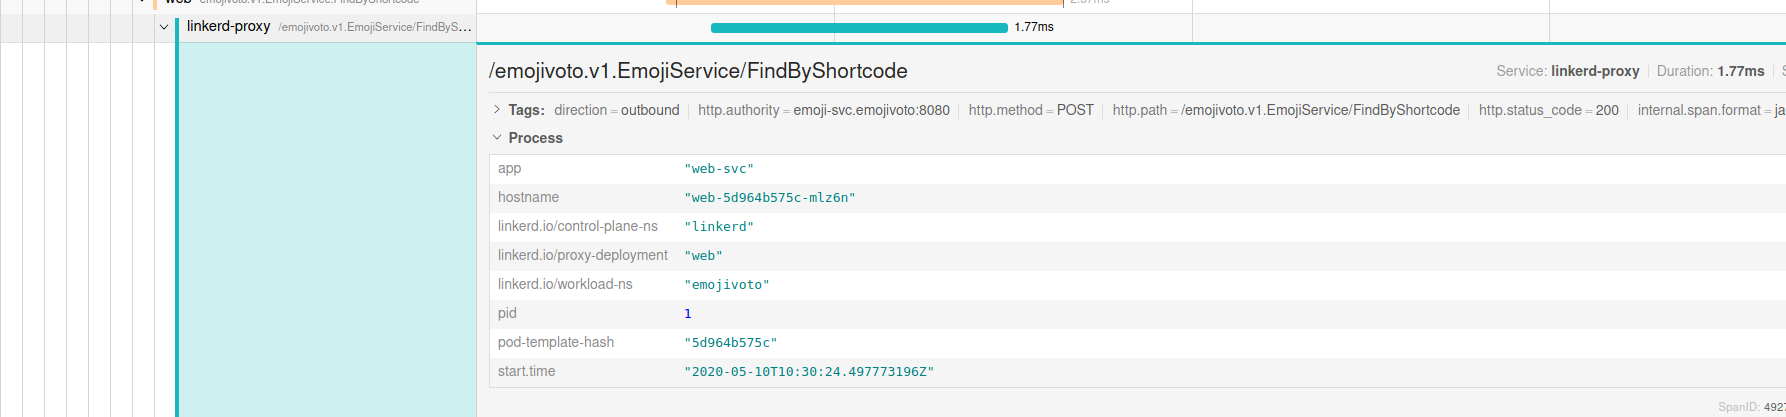
Now we not only send linkerd-proxy spans, but we also add awesome meta-data about the work-load so that you can query based on workload,workloadKind, namespace, etc
Jaeger Integration in Linkerd
In Linkerd, Grafana Integration is already present through which you can directly jump onto the dashboards of any workload like deployment, pod, etc, directly from the linkerd-web UI.
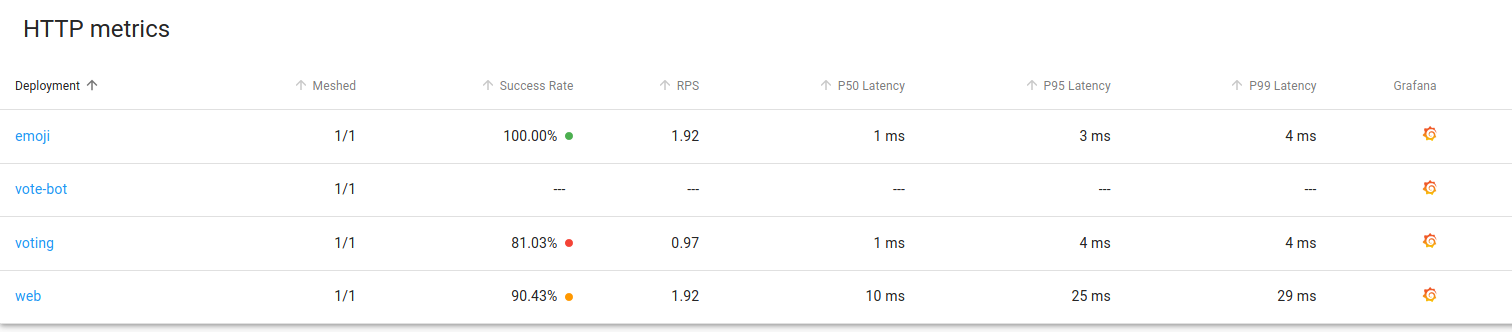
Now, we did the same with Jaeger, if you have the tracing add-on enabled. You should be able to see the jaeger link now.
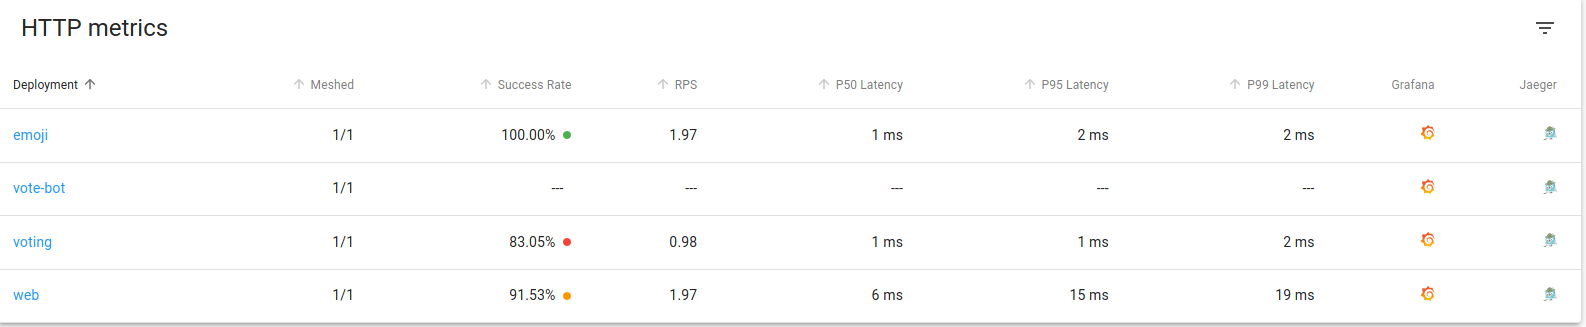
This is possible because, we have the application metadata as tags in spans, and we open a link with that query tags.