Tracing the Linkerd Control Plane
Posted on
Distributed Tracing, is being considered one of the most useful technique to get observability into your applications. It allows us to see the whole life-span of a request through multiple micro-services, along with contextual metadata.
Service Meshes in general have also been working on this front, to make their data-plane proxies add relevant spans. So, that users can understand how much latency the proxy is adding, with any associated metadata.
Linkerd 2.6 was released with experimental tracing support and there's an excellent blog-post from Alex Leong on getting started started with distributed-tracing. I highly recommend checking that out.
I have been expecially working on adding tracing support to the control-plane side of things. Having visibility into your network, is one of the reason why you should use a service mesh. We have been always dog-fooding these ideas on the linkerd control-plane. Tracing the control-plane adds to this, i.e to have observability into the control-plane request data when needed.
Demo
Enabling Control-Plane tracing with default arguements, can just be done by using the control-plane-tracing flag during linkerd installation.
If you are using Helm, look out for the ControlPlaneTracing value in values.yaml.
linkerd install --control-plane-tracing | kubectl apply -f -
This will configure the control-plane components and their proxies to send the traces data at linkerd-collector.{{.Namespace}}.svc.{{.ClusterDomain}}:55678
When we started this effort, we had a decision to make: should we use OpenTracing, OpenCensus, or OpenTelemetry? In the end, we went for OC because OpenTelemetry is still in alpha and OpenTracing didn’t have a collector. For those not familiar with the landscape, the OpenTracing and OpenCensus are merging into the OpenTelemetry project, and it's our intention to use it in the future, once things become more stable.
OC Collector and Jaeger All-in-one instance can be installed by running
linkerd inject https://gist.githubusercontent.com/Pothulapati/245842ce7f319e8bcd02521460684d6f/raw/52c869c58b07b17caeed520aa91380c2230d6e0c/linkerd-tracing.yaml --manual | kubectl apply -f -
This will install the tracing components to the linkerd namespace, and they should start recieving the tracing data.
Note: Its required that the OC-Collector is injected with the linkerd proxy, for the control-plane proxies to send the tracing data through a secure connection.
Now, The Jaeger dashboard can be seen by running.
kubectl -n linkerd port-forward svc/linkerd-jaeger 16686:16686
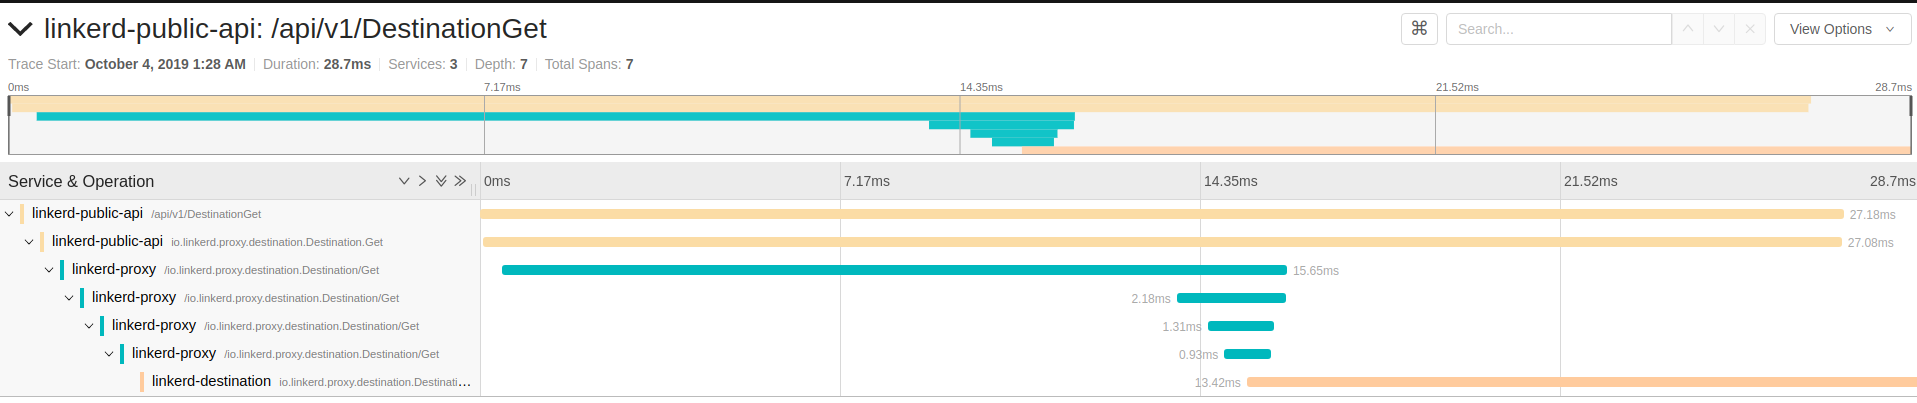
The dashboard can be visualised by opening localhost:16886 with the Linkerd trace data.

Conclusion
First of all, I would like to thank CNCF for sponsoring my work. Special thanks to Juraci Paixão Kröhling for supporting me from the start, taking the effort for a cross-project mentorship and helping me wherever possible. Thanks to Thomas Rampelberg and the whole Linkerd team for always being there to help me.
I definitely had great fun learning about the whole distributed tracing space in general. The Out-of-box experience from the tracing libraries for grpc and http handlers is really awesome.
Future Work
Now that we have the basics done, The plan is to have an excellent Installation experience for the tracing components to use directly. and also use this information to power dashboards and the very useful linkerd-cli. Expect them in the next Linkerd releases.
Also, Once the Open Telemetry side of things get stabilized, they will be used.